
Family size, Increasing block tariff and Economies of scale of household electricity consumption in Vietnam from 2010 to 2014
Family size, Increasing block tariff and Economies of scale of household electricity consumption in Vietnam from 2010 to 2014
Nguyen Hoai-Son[1] and Ha-Duong Minh[2]
Abstract
Household electricity consumption potentially offers economies of scale, since lighting, cooling or cooking can be shared among household members. This idea needs to be tested empirically. Under an increasing block tariff schedule the marginal and average price of electricity increases with total consumption. Does this effect offset economies of scale in the larger families? This paper uses data from Vietnam Household Living Standard Survey (VHLSS) in 2010, 2012 and 2014 to investigate whether there are economies of scale for Vietnam household electricity consumption in that period. The data will be tested formally by an OLS model and checked robustness by visualization of local linear regressions. Estimated results and robustness check confirm that in general, economies of scale do exist for household electricity consumption in Vietnam from 2010-2014.
Keywords: household economies of scale, electricity use, increasing block tariffs.
Date of receipt: 31st Oct.2017; Date of revision: 15th Mar.2018; Date of approval: 1st Apr.2018
- Introduction
Vietnam has changed to market-oriented economy in 1986, however, electricity is still one of some special goods that have prices set by government. Since 1994, the government has set electricity price in increasing block form to support for low-income household and give a disincentive to high consumption due to the mismatch between demand and supply. In the newest proposal for electricity price reform, EVN proposed three alternative schedules including two increasing block tariffs and one single price (EVN, 2015). However, many experts disagree with the single price structure and are in favor of increasing block tariffs. The debatable topics are the number of blocks; the price gaps between blocks and the impacts of the increasing block tariffs on low income households (Châu Anh, 2015; Đình Dũng, 2015).
Yet, there is no research or official discussion on the impact of the increasing block tariffs on large size households. This is a serious gap since large size households will suffer the high price due to high demand while these households usually have low income[3]. In that case, increasing block tariffs may turn out to be a penalty for some low-income households instead of protecting them.
This paper uses data from Vietnam Household Living Standard Survey (VHLSS) 2010-2014 to investigate whether the current increasing block tariffs have negative impact on large size households’ electricity consumption. In other words, we examine how the increasing block tariff impacts on economy of scale of household electricity consumption in Vietnam from 2010 to 2014. The result will provide empirical evidences for policy makers to design electricity price in future. The paper contains five parts. The next part is literature review following by data and methodology. The next one is results and discussion. The last part is conclusion.
- Literature review
Economies of scale
Economies of scale in household consumption is the phenomenon in which the cost per capita that maintains a given level of living standard may reduce as household size increases (Nelson, 1988, p. 1301). Economies of scale of household consumption may come from three sources (see Nelson, 1988 for review).
- First, economies of scale come from increasing return in household production such as cooking meals.
- Second, it may come from “bulk buy”. When household size increases, demand for goods and services increases. The household may have discount for purchasing large amount of goods and services.
- Third, it may come from the consumption of public goods in which the consumption of one household member does not rule out or rule out completely the consumption of other members. Since the public goods such as lighting or air conditioners can be shared, as the size of household increases, the cost of the goods per capita declines. In addition, the increase in household sizes can also reduce the cost per capita for that public goods because of the increases in the utilization rate of the public goods which are indivisible such as water heating, pilot light or refrigerator room.
So far, economies of scale in household consumption are found in many goods and services. Nelson (1988) found substantially and statistic significantly economies of scale for 5 classes of goods and services including food, shelter, household furnishing/operation, clothing and transportation in US data during 1960/61 and 1972/73. Deaton and Paxson (1998) found that at any given household expenditure per capita, expenditure per head on food falls as the household size increases in seven countries including USA, Great Britain, France, Taiwan, Thailand, Pakistan and South Africa.
A major empirical problem in detecting economies of scale is to separate the impact of household size from the impact of household composition. Nelson (1988, p. 1302) indicated that “Observed household demands may be expected to vary with household size not only because of economies of scale, but also because of the varying preferences or needs of household members, from infants to grandparents.”
Two approaches are employed to handle this problem so far. The first approach is to require strictly assumption that preferences are identical among all household members (Nelson, 1988). In empirical section, Nelson (1988) studies only all-adult households with “heads” aged 35-55. Thus, he can get rid of the impacts of composition factor in observed demand.
The second approach is to use two separate variables for household size and composition (Ironmonger, Aitken and Erbas, 1995; Deaton and Paxson, 1998). The household size variable is the total number of households’ members. The household composition can be represented by category variables (Ironmonger, Aitken and Erbas, 1995) or continuous variables (Deaton and Paxson, 1998). Ironmonger, Aitken and Erbas (1995) uses this approach for 3 types of adult-only household including young household with adults from 15 to 45, older household with adults over 45 and mixed household with adults over 15. Deaton and Paxson (1998) use (k-1) variables for household composition. Each household is separated to k groups defined by age and sex. Each of the (k-1) variable above is the ratio to household size of household members who fall in the corresponding group. In this approach, the variable household size corresponds to the concept of doubling the number of household members while keeping family composition constant. Therefore, the approach can eliminate the impact of difference in members’ preference in household consumption.
Of all approach above, Deaton and Paxson (1998)’s approach has an important side effect advantage. In addition to identifying the impact of household size, it allows to investigate the differences in preference between a certain group of the (k-1) groups with the base group (the kth group). Therefore, this paper will apply Deaton and Paxson (1998)’s approach. Each household will be separated into three groups including children who are less than or equal to 15, adults from 16 to 59 and elders who are over 60. Two variable children ratio and elder ratio will be employed to represent for household composition. The coefficients of the variables indicate whether there is difference in consumption between a child or an elder and an adult.
Economies of scale for household electricity consumption
Electricity consumption has high potential for economies of scale in household consumption since it is a typical public good. People do not consume electricity directly but indirectly via appliances which can be shared among household members such as lighting or cooling devices. When a household’s size increases, the household can maximize the use of shared goods including electricity use (Ironmonger, Aitken and Erbas, 1995). Therefore, the household can decrease the amount of electricity consumption per capita.
So far, researchers have found empirical evidences for economies of scale in household electricity consumption. Ironmonger, Aitken and Erbas (1995) investigated the data of Australia in 1987 and 1990 and found that as household size increases, energy-efficiency increases and electricity expense per capita decreases. Filippini and Pachauri (2004) found in India that houses with larger and younger household heads have lower electricity consumption than those have fewer members and older household heads. However, whether the economies of scale exist or not is still in question because electricity in many countries including Vietnam, has increasing block tariff instead of “bulk buy” price as other goods. The increasing block tariff means that the higher level of consumption, the higher price the household has to pay. When a household becomes larger, its demand for electricity increases. This leads to an increase in price which can offset the economies of scale from saving in quantity.

Figure 1. Economies of scale’s channels of household electricity consumption
Note. kWh – Household consumption of electricity in kWh; P – Electricity price
kWh/n – Electricity consumption per capita in kWh
Source. Authors compiled
The diagram shows the two effects of changes in household size on electricity expense per capita. The first effect is quantity effect due to the sharing characteristic. When household size increases, the household electricity consumption in kWh increases however, due to sharing characteristic, the electricity consumption per capita in kWh decreases. The second is price effect. When the household size increases, the household electricity consumption in kWh increases. Thus, the price each member has to pay increases due to increasing block tariffs. If quantity effect dominates, households enjoy economies of scale. If price effect dominates, diseconomies of scale exist.
This paper will use VHLSS data from 2010-2014 to test which effect is stronger for household electricity consumption in Vietnam.
Data and Methodology
Model specification
The paper will employ econometric model with OLS estimator to test the economies of scale in electricity consumption. The model is based on Engel curve function for electricity. It includes not only variables of electricity expense and household size but also some other well-known control variables for electricity consumption such as household income, dwelling and climate conditions.
ln elec_sharei = β0 + β1 ln sizei + β2 children_ratioi + β3 elder_ratioi+ β4 ln inc_avei + β5 ln cdd25 + β6 renti + β7 ln sqmi + β8 y2012i + β9 y2014i + ∑ βk citycodeki + εi
in which:
|
elec_share |
= the share of electricity expenditure last month (of the survey month) on household’s monthly income |
|
Size |
= total number of household members |
|
children_ratio |
= fraction of members who are less than or equal to 15-year old over size |
|
elder_ratio |
= fraction of members who are over or equal to 60-year old over size |
|
inc_ave |
= household’s monthly per capita income |
|
cdd25 |
= cooling degree days of the month before survey month |
|
Rent |
= 1 if the household pay rent; =2 if the household owns the dwelling |
|
Sqm |
= total area of the dwelling in term of square meter |
|
y2012, y2014 |
= dummy variables for the years of 2012, 2014 |
|
citycodek |
= vector of dummy variables for each city with Ha Noi is the base |
In the model, the dependent variable is the share of electricity in monthly household income. As Deaton and Paxson (1998) indicated, in order to calculate economies of scale, we compare expense per capita of different households at given income per capita. It will be equivalent to comparing the ratio of the expense per capita over income per capita which is exactly the share of electricity expense on total income.
The variables size represents for household sizes. The variable size represents for the concept of doubling the household while keeping the same household composition which is control by children_ratio and elder_ratio variables. If the coefficient of variable size (β1) is positive, households have economies of scale in electricity consumption. If it is negative, there are diseconomies of scale in electricity consumption.
Variables children_ratio and elder_ratio represents for household composition. Household composition is classified to 3 types of members. Children are members who are less than or equal to 15-year old. Elders are members who are over or equal to 60-year old. Adults are members from 16 to 59. The coefficients of the two variables will reveal the differences in electricity demand between a child/an elder and an adult.
Variable inc_ave controls for households’ wealth. The variable ensures the concept that doubling a household means doubling both people and resource (Deaton and Paxson, 1998).
Cdd25 represents for climate condition which can impact on electricity demand. Cooling degree day (cdd) is the amount of temperature that need to be cooled down to reach a certain base temperature for every day of a month. In this paper, cdd25 is calculate for the base of 25oC. The formula of cdd25 is the following
Cdd25 = ∑(tavg-25) for all days of a month which have average daily temperature (tvag) higher than 25oC.
Dummy variables for years and cities capture unobserved factors which vary across year and geographic locations.
Data
The data for cdd25 comes from Global Historical Climatology Network (GHCN) of National Centers for Environmental Information (NOOA); GHCN provides daily temperature of 15 weather stations in Vietnam. The cdd25 is calculated for each station. Each household is assigned the cdd25 of the nearest station to its ward.
Other data such as electricity expense, income, household demographic, dwelling condition are extracted from Vietnam Household Living Standard Survey (VHLSS) of three years 2010, 2012 and 2014. Since 2002, for every 2-year, VHLSS was conducted national wide by General Statistics Office of Vietnam (GSO) to collect data on income and expense of Vietnam household covering many areas such as demographics, education, medical care, employment, income, expense.
The model will run only for households living in urban area due to the nature of electricity price policy in Vietnam. Vietnamese government has two different tariff schedules for urban and rural areas. Urban area has an explicit retail increasing block tariff which applies to individual household. By contrast, rural area does not have uniform tariff schedule for households. Instead, rural area has a wholesale increasing block tariff which applies for wholesale organizations. These organizations then apply their own retail prices for households. Some organizations may adapt the wholesale prices. However, some other can apply single price policy.
All the variables in money term has unit of million VND and adjusted to 2010 price by consumer price index (cpi). Data descriptive is detailed in appendix.
- Results and discussion
The model passes all diagnostic tests for OLS detailed in appendix B.
Table 1. OLS Estimate results
|
ln elec_share |
OLS model |
|
|
ln inc_ave |
-0.4789 |
*** |
|
|
(-59.08) |
|
|
ln size |
-0.3278 |
*** |
|
|
(-27.20) |
|
|
children_ratio |
0.0392 |
|
|
|
(1.54) |
|
|
elder_ratio |
0.0057 |
|
|
|
(0.31) |
|
|
ln cdd25 |
0.0351 |
*** |
|
|
(8.90) |
|
|
Rent |
0.1060 |
*** |
|
|
(4.67) |
|
|
ln sqm |
0.2840 |
*** |
|
|
(35.18) |
|
|
N |
14,764 |
|
|
F |
91.41 |
|
|
Adj R-squared |
0.3030 |
|
Note: t statistics in parentheses; * p<0.05, ** p<0.01, *** p<0.001
The table only display estimated results for some selected variables.
Source. Authors estimate
Control variables
Overall, the estimated result for control variables are as expected. First, the result shows that if income per capita increases one per cent, the share of electricity expense will decrease 0.47 per cent. It implies that electricity demand is inelastic with respect to income which is similar to Alberini et al.(2011) and Branch (1993). The reason may be that this is a static model for short-run demand. In short-run, “the effects of income are conditioned on the stock of appliances and housing characteristics” (Branch, 1993). In addition, for some rich families, they may reach the saturation point of using electricity. Thus, an increase in income have tiny effects on their electricity consumption.
Second, the standardized coefficient of climate condition (cdd25) is positive and significant meaning that electricity share in income will increase if weather becomes hotter. It is reasonable because Vietnam is a tropical country with hot weather. When the average temperature increases, especially in summer, households may have to devote more income for cooling effort such as using fans or air conditioners. In addition, the result can also be explained by urban heat island effects since the model only run for urban area.
Third, beta coefficients of dwelling condition (sqm and rent) show that the higher the total area, the higher electricity share in income and households who rent houses also have higher electricity share. The estimated results for the total area (sqm) is similar to Kavousian et al. (2013). Kavousian et al. (2013) argues that a larger dwelling requires more energy for cooling/heating because it has large volume to condition and have higher loss with outside. For the rent variable, it may be strange at first glance since people who rent houses normally are not wealthy people. However, in Vietnam, people who rent a house normally live with landlords and must pay highest block prices. Thus, the beta coefficient of the rent variable is reasonable.
Household composition
Table 1 shows that there are no significant differences in electricity demand between an adult and a child or an elder. This result contradicts to Brounen et al. (2012). Brounen et al. (2012) analyzed data of 300,000 Dutch households in 2008-2009 and found that elder households consume two to four per cent less electricity than middle-aged married couples do. They explained that though elders stay more time at home but use less energy-consuming appliance. In addition, they also found that in comparison to electricity consumption of middle-aged married couples, families with children have lower per capita electricity consumption in kWh. Families with children less than four-year old have higher per capita consumption while families with children from five to 12 and above 12-year old has increasing higher per capita consumption than middle-aged married couples do. They explained by “Nintendo-effect” where older children use intensively television, gaming devices and personal computers.
In Vietnam, the indifference in demand between an adult and an elderly person may come from the fact that elderly people have higher saving attitude. In this case, the saving attitude obviates any increase in electricity consumption that incurs from their longer time stay at their residential. The saving attitude may come from two sources. First, elderly people who were over 60 in 2014 had passed both two wars in Vietnam when living standard is extremely low. Thus, saving attitude is built in their daily activities. Second, at the age of 60, elderly people get retired. Their retired salary is considerably low in comparison to their income at work. They need to saving money to cope with unexpected events in their retired lives.
The indifference in demand between an adult and a child may come from two facts. First, the “Nintendo-effect” does not work in Vietnam. Children in Vietnam also play game intensively. However, instead of playing at home as in European countries, they go to gaming centers which are popular in Vietnam. Their electricity expenditure for gaming then is not included in households’ electricity bills. Sanquist et al. (2012) investigated lifestyle factors in US residential electricity consumption. They identified five lifestyle factors associated with air conditioning, laundry usage, personal computer usage, climate zone of residence and television use. The key different factor between a child and an adult in Vietnam is personal computer usage for gaming. If children go out for playing game, it should be no difference in electricity demand between a child and an adult. Second, among the five life style factors, air conditioning is also another key factor cause the differences in electricity demand between a child and an adult. However, in Vietnam, during hot days, many households apply a saving strategy by gathering all members in a main room and sharing an air conditioner. Thus, there should be no difference between a child and an adult in electricity consumption.
Household sizes – economies of scale
With regards to the key variable of the paper, estimated result shows that when a household doubles keeping the same composition and resources, the share of electricity expense decreases 32.78 per cent. This implies that in general, household consumption on electricity still enjoy economies of scale regardless of increasing block tariffs. In other words, quantity effect of an increase in household size dominates the price effect.
The result may come from the fact that a large fraction of sample are households with small and medium sizes. Households with less than or equal to four members account for 73 per cent of the sample. Households with less than or equal six members account for 95 per cent of the sample. Under an increasing block tariff, the larger a family, the higher electricity consumption following by a higher average price the family must pay. As consequence, the larger a family is, the larger price effect is. In other words, the price effect on small or medium size households is smaller than on large size households. In the case that a large fraction of sample are small and medium size households, it is reasonable to have quantity effect dominating price effect.
Robustness check
A local regression estimate is employed to do robust check for the result. The idea is to regress electricity expense share in household income (elec_share) on monthly income per capita (inc_ave) for different type of households.
Elec_share = f(inc_ave) + ui where f(.) is not specified.
Household types are designed to incorporate the idea of doubling a household keeping its composition constant. In this paper, a household composition has the pattern of children/adults/elders. For example, we will have household types as households of (0, 1, 0), (0, 2, 0), (0, 3, 0) or (1, 1 ,0), (2,2,0), (3, 3, 0). This method allows us to compare whether a larger household type has smaller electricity share at any given income per capita level.
Local regression smoother is a non-parametric method which let data suggests appropriate function form of f(.) instead of imposing a structure on data as parametric method. The procedure is detailed in Fan and Gijbels (1991). First, dividing inc_ave to 50-point equally periods. At any point inc_avem, run a local weighted average of elec_share on the neighborhood of inc_avem. The closer inc_avei to inc_avem, the higher weight inc_avei has. There is no or little weight assigned for inc_avei which is far from inc_avem. The regressions are then used to calculate the expected value of elec_share at each point of inc_avem.

The full procedure will calculate the bootstrap estimates of standard errors. However, this part is only for doing robustness check for OLS estimate results, thus, we only use the local linear regression estimates to visualize the relationship between elec_share and inc_ave for different type of households.
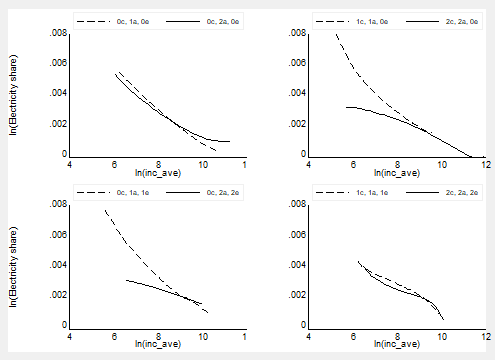
Figure 2. Non-parametric Engel curve for different type of households
Note. Legends are the compositions of (children, adults, elders)
Source. Authors estimate
The figure 2 shows the estimates of non-parametric Engel curves for different type of households. Each graph is for a specific type of households. The upper left graph is adult-only households. The upper right is adults with children households. The lower left is adults with elders. The lower right is adults with both children and elders. In each graph, straight lines and dash lines are lager and smaller households of the same household type. The horizontal axis is income per capita and the vertical axis is electricity share on household income. At a given level of income per capita, if a straight line is below dash line the household type has economies of scale in electricity consumption and vice versa, the household type has dis-economies of scale.
In general, the visualization of local linear regression supports for the econometric estimates. First, the downward slope of the local regression curves show that the proportion of income spent on electricity declines when the income per capita increases. Second, the figure 2 shows that the straight lines are higher than the dash lines for a major range of income per capita. This means that at a given income per capita, electricity share of smaller households is higher than that share of larger households. In other words, economies of scale do exist for household electricity consumption in Vietnam.
However, the visualization also reveals an interesting trend. While the econometric approach shows the existence of economies of scale on average for all type of households, the non-parametric approach discloses a more sophisticated story. There are cross points between straight lines and dash lines at high level of income per capita for all type of families. This suggests that the economies of scale may not exist for rich families. It is worth to note that the cross points are at the income per capita level of about 8,103 thousand VND per month which is higher than the income level of 95 per cent of the sample. In other words, the econometric estimates are still true for 95 per cent of the sample. Nevertheless, it still needs a further qualitative research to explain the electricity consumption behavior of the remained five per cent.
- Conclusion
This study has illustrated the economies of scale in household electricity consumption using VHLSS data 2010, 2012, 2014. Electricity has high potential for economies of scale since it is a “public goods” which the consumption of one member does not rule out the consumption of others. Thus, an increase in household size creates a quantity effect where kWh consumption per capita decreases. However, the electricity tariff in Vietnam is in increasing form. In this case, an increase in household size creates a price effect where the higher using block is, the higher price applied. The higher price may rule out the saving from quantity effect. The economies of scale exists if the quantity effect dominates the price effect.
Estimates from econometric model provides empirical evidence that in general, there are economies of scale for household electricity consumption. When a household doubles keeping the same composition and resources, the share of electricity expense in household income decrease 32.78 per cent. This may come from the fact that most households in the sample are at small and medium size. These household usually consume at small or medium blocks. An increasing block tariff means that the higher electricity consumption, the higher price effect. Therefore, at small or medium blocks, the price effect may not be strong enough to cancel the saving from quantity effect.
Robustness check with non-parametric method supports for econometric estimates and reveals an interesting trend. In general, the robust check estimates support for the economies of scale in household electricity consumption. However, for certain household types, economies of scale does not exist for high-income families.
The results implied that there is still a room for government in adjusting the electricity tariff without making penalty for low income and large households. Besides, it also suggests a hypothesis that is worth to test and explain in future. The existence of economies of scale in household electricity consumption depends not only on the nature of price policies but also on the wealth condition of households.
References
- Alberini, A., Gans, W. and Velez-Lopez, D. (2011) ‘Residential consumption of gas and electricity in the US: The role of prices and income’, Energy Economics, 33(5), pp. 870–881.
- Branch, E. R. (1993) ‘Short run income elasticity of demand for residential electricity using consumer expenditure survey data’, The Energy Journal, pp. 111–121.
- Brounen, D., Kok, N. and Quigley, J. M. (2012) ‘Residential energy use and conservation: Economics and demographics’, European Economic Review, 56(5), pp. 931–945.
- Châu Anh (2015) ‘Chuyên gia chê biểu giá điện của EVN’, 19 September. Available at: http://www.tienphong.vn/kinh-te/chuyen-gia-che-bieu-gia-dien-cua-evn-911177.tpo (Accessed: 11 September 2017).
- Deaton, A. and Paxson, C. (1998) ‘Economies of scale, household size, and the demand for food’, Journal of political economy, 106(5), pp. 897–930.
- Đình Dũng (2015) ‘Hội thảo cơ cấu biểu giá điện: Nhiều quan điểm đồng nhất’, 22 September. Available at: http://baocongthuong.com.vn/hoi-thao-co-cau-bieu-gia-dien-nhieu-quan-diem-dong-nhat.html (Accessed: 11 September 2017).
- EVN (2015) Đề án cải tiến cơ cấu biểu giá. Available at: http://minhbach.moit.gov.vn/App_File/userfiles/files/De%20an%20cai%20tien%20co%20cau%20bieu%20gia-full.pdf (Accessed: 15 September 2017).
- Fan, J. and Gijbels, I. (1991) Local linear smoothers in regression function estimation. Department of Statistics [University of North Carolina at Chapel Hill].
- Filippini, M. and Pachauri, S. (2004) ‘Elasticities of electricity demand in urban Indian households’, Energy policy, 32(3), pp. 429–436.
- Ironmonger, D. S., Aitken, C. K. and Erbas, B. (1995) ‘Economies of scale in energy use in adult-only households’, Energy Economics, 17(4), pp. 301–310.
- Kavousian, A., Rajagopal, R. and Fischer, M. (2013) ‘Determinants of residential electricity consumption: Using smart meter data to examine the effect of climate, building characteristics, appliance stock, and occupants’ behavior’, Energy, 55, pp. 184–194.
- Nelson, J. A. (1988) ‘Household economies of scale in consumption: theory and evidence’, Econometrica: Journal of the Econometric Society, pp. 1301–1314.
- Sanquist, T. F. et al. (2012) ‘Lifestyle factors in US residential electricity consumption’, Energy Policy, 42, pp. 354–364.
Appendix A. Data description
Table 2. Household size (unit: number of members)
|
Size |
Freq. |
Percent |
Cum. |
|
1 |
948 |
5.53 |
5.53 |
|
2 |
2,393 |
13.95 |
19.47 |
|
3 |
3,597 |
20.97 |
40.44 |
|
4 |
5,601 |
32.65 |
73.08 |
|
5 |
2,585 |
15.07 |
88.15 |
|
6 |
1,302 |
7.59 |
95.74 |
|
7 |
433 |
2.52 |
98.26 |
|
8 |
170 |
0.99 |
99.25 |
|
9 |
78 |
0.45 |
99.71 |
|
10 |
29 |
0.17 |
99.88 |
|
11 |
11 |
0.06 |
99.94 |
|
12 |
6 |
0.03 |
99.98 |
|
13 |
4 |
0.02 |
100 |
|
Total |
17,157 |
100 |
|
Table 3. Household composition
|
Variable |
Obs |
Mean |
Std. Dev. |
Min |
Max |
|
children_ratio |
17157 |
0.202318 |
0.20052 |
0 |
1 |
|
elder_ratio |
17157 |
0.149135 |
0.272658 |
0 |
1 |
Table 4. Household income and dwelling condition
|
Variable |
Obs |
Mean |
Std. Dev. |
Min |
Max |
|
inc_ave |
17157 |
3.261219 |
2.650165 |
0.045 |
46.766 |
|
sq_m |
17146 |
90.06876 |
61.16 |
4 |
720 |
Note. Unit of inc_ave: million VND/month; sq_m: squared meters.
Table 5. Rent
|
Rent |
Freq. |
Percent |
Cum. |
|
Yes |
834 |
4.86 |
4.86 |
|
No |
16,312 |
95.14 |
100 |
|
Total |
17,146 |
100 |
|
Table 6. Climate condition
|
Variable |
Obs |
Mean |
Std. Dev. |
Min |
Max |
|
cdd25 |
17157 |
69.80727 |
51.60391 |
0 |
202.7778 |
Appendix B. Diagnostic test for the OLS model
Test of the functional form of the conditional mean
Ramsey RESET test using powers of the fitted values of lelec_share
Ho: model has no omitted variables
F(3, 14689) = 2.26
Prob > F = 0.0791
Heteroskedasticity test
Breusch-Pagan / Cook-Weisberg test for heteroskedasticity
Ho: Constant variance
Variables: fitted values of lelec_share
chi2(1) = 0.16
Prob > chi2 = 0.6875
Multicolinearity test
Table 7. Multicolinearity test
|
Variable |
VIF |
1/VIF |
|
lsize |
1.6 |
0.626362 |
|
lsq_m |
1.54 |
0.650555 |
|
linc_ave_cpi |
1.44 |
0.694256 |
|
Rent |
1.35 |
0.742249 |
|
elder_ratio |
1.3 |
0.766568 |
|
Children_ratio |
1.36 |
0.734318 |
|
lcdd25 |
1.21 |
0.829684 |
Note. Table shows results of selected variables
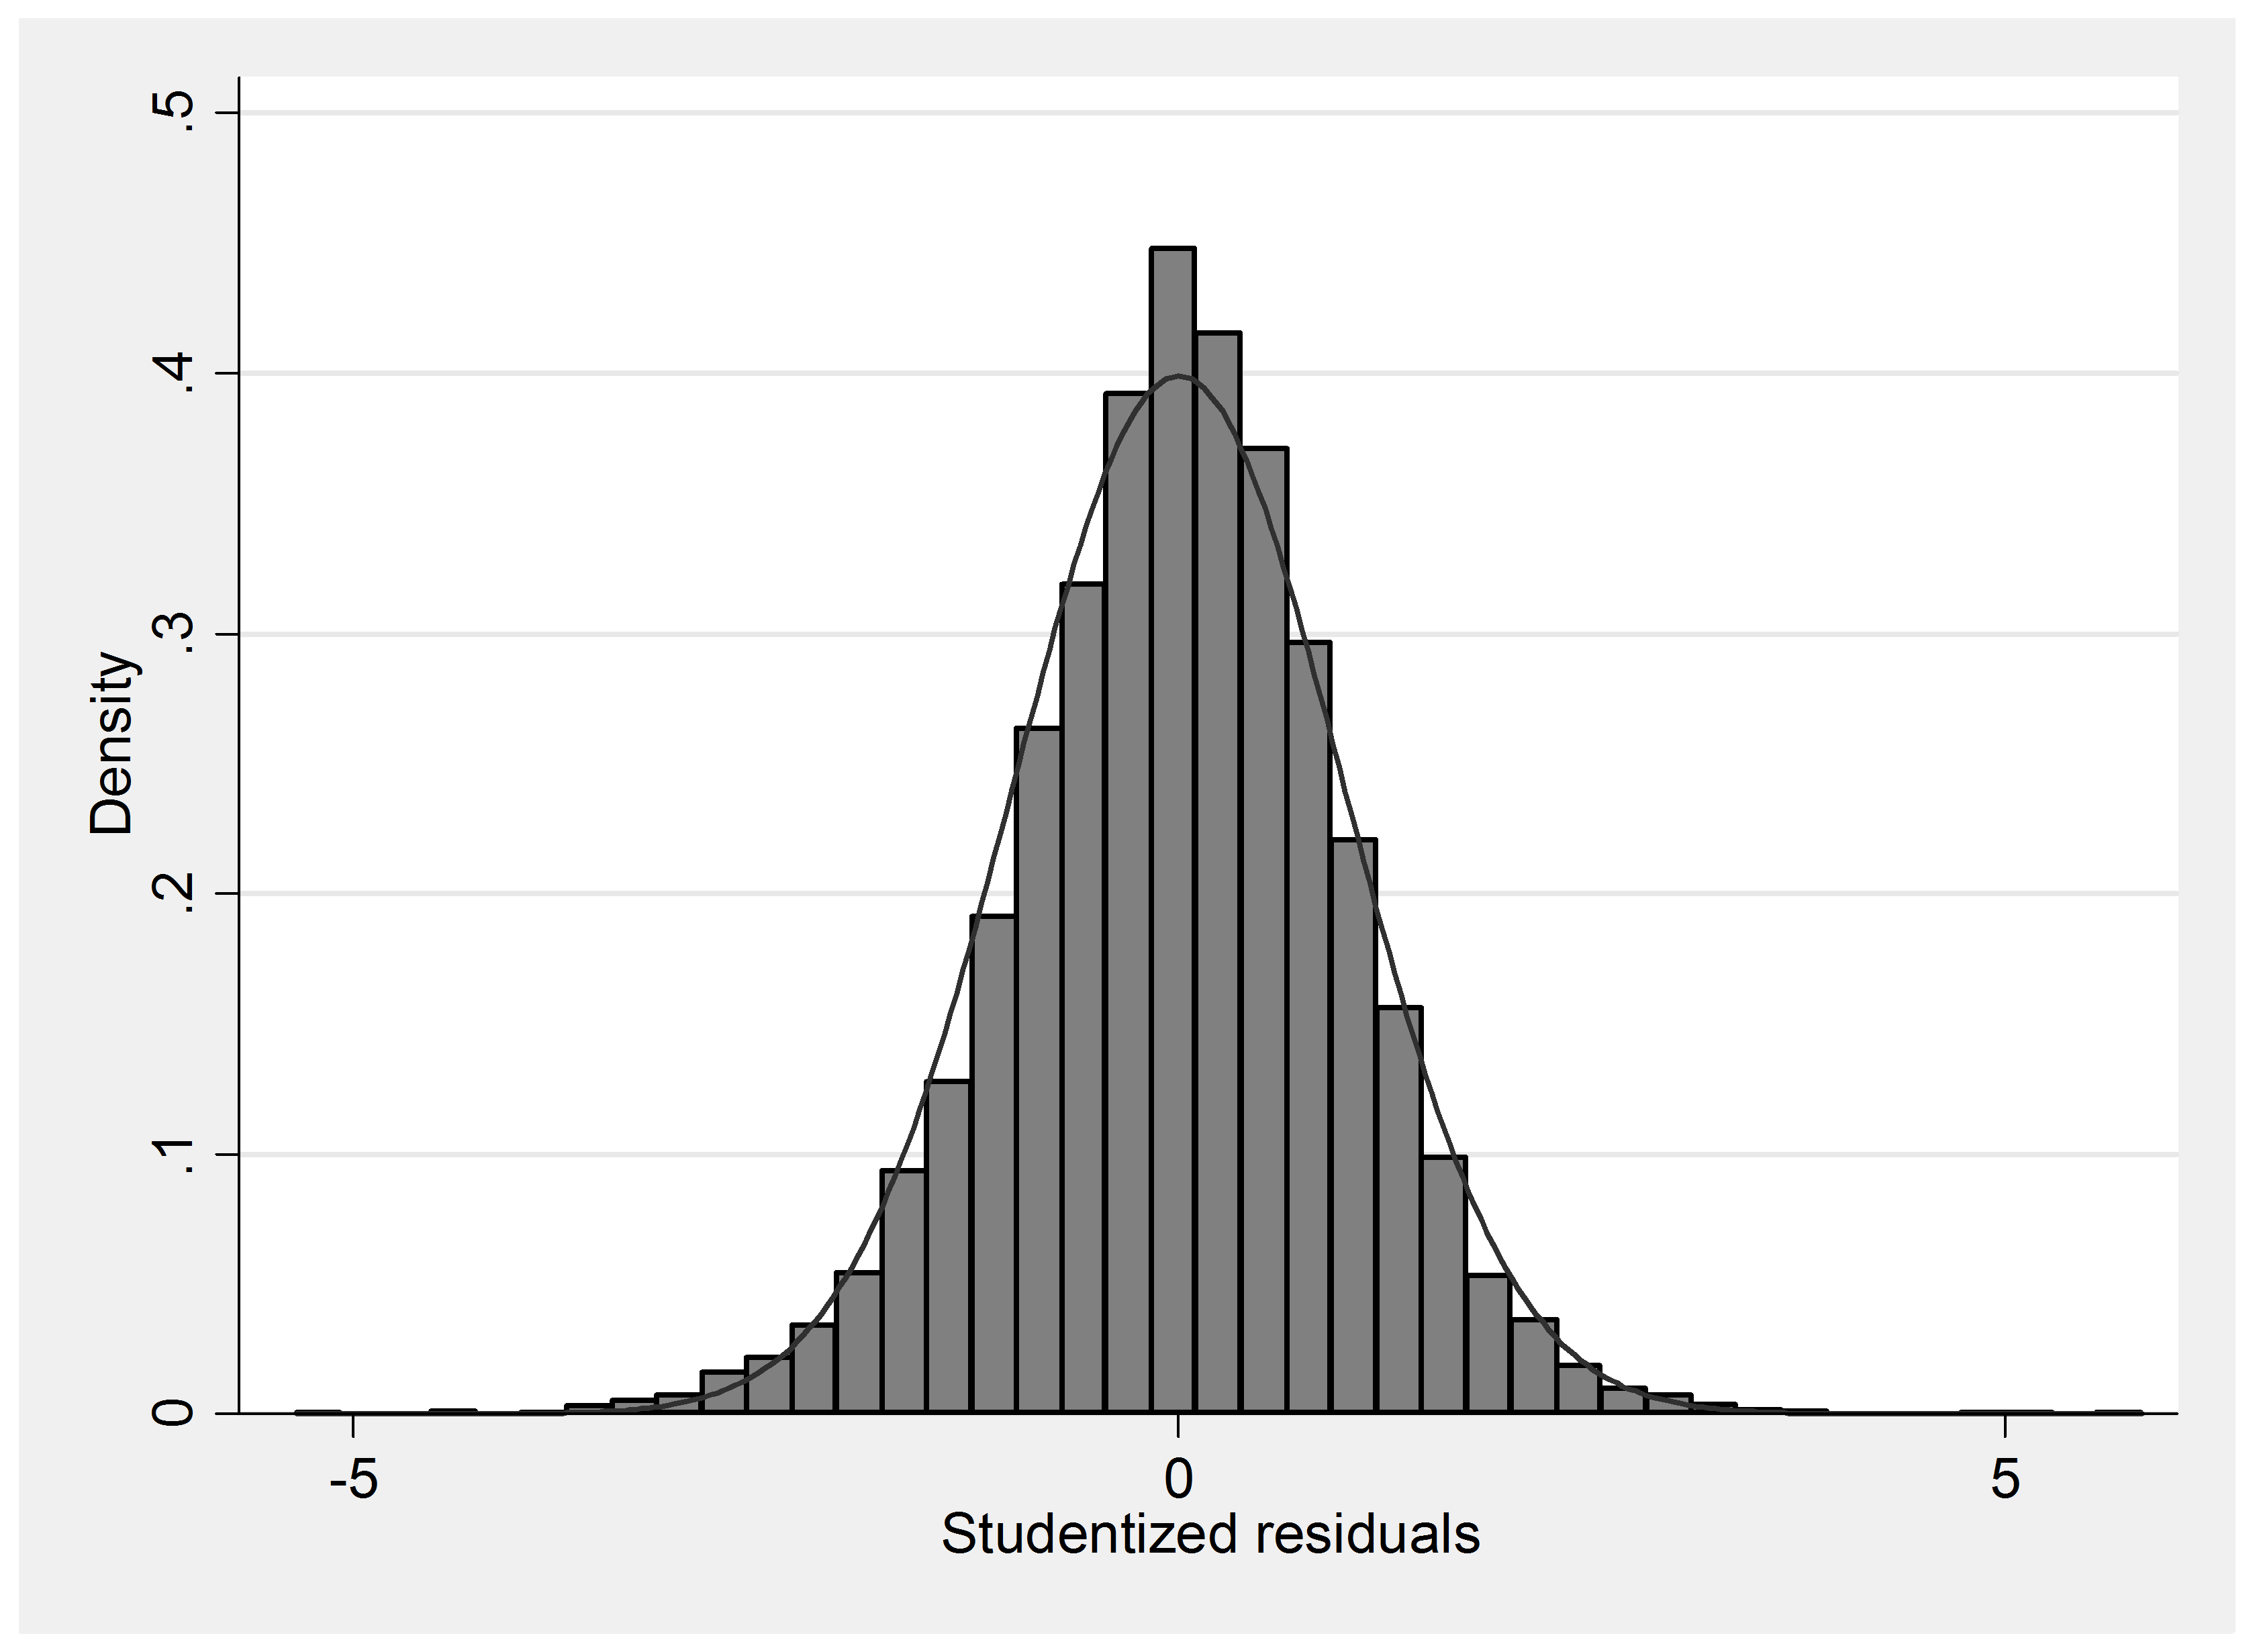
Normal distribution of residuals
Figure 3. Normal distribution of residuals
The paper has been presented and revised after Vietnam Economist Annual Meeting – VEAM2017
The authors would like to thank Welcome Trust Seed Award for providing financial support for this research. We also would like to thank Dr. Nguyen Ngoc Anh (Depocen) for his comment for the results and discussion part.
[1] PhD. Clean Energy and Sustainable Development Lab (CleanED) and National Economics University (NEU), Vietnam. Email: Địa chỉ email này đang được bảo vệ từ spam bots. Bạn cần bật JavaScript để xem nó.; Địa chỉ email này đang được bảo vệ từ spam bots. Bạn cần bật JavaScript để xem nó.
[2] PhD. Clean Energy and Sustainable Development Lab (CleanED), Vietnam and International research center on environment and development (CIRED), National Center for Scientific Research (CNRS), France
[3]Correlation between household size and income per capita in VHLSS 2014 is negative and significant at the 0.05 significance level